(Click here to return to Research Portal)
Sources:
Highlighted findings
In Singapore resident population (2020)
- Number of non-religious individuals: 692,528
- Gender ratio: 51.41% male, 48.58% female
- Proportion of resident population: 20.0%
(Click here to access Singstats table generator)
% of non-religious per age group
- 15-19 — 23.8
- 20-24 — 24.5
- 25-29 — 26.0
- 30-34 — 26.3
- 35-39 — 23.4
- 40-44 — 21.3
- 45-49 — 19.2
- 50-54 — 17.5
- 55-59 — 15.6
- 60-64 — 14.9
- 65-69 — 15.7
- 70-74 — 15.7
- 75-79 — 16.1
- 80-84 — 13.7
- 85< –11.2
Country of origin
- Singapore 499,331
- Mainland China 96,481
- Malaysia 61,291
- Europe 5,611
- Indonesia 4,912
- India 1,957
- USA and Canada 1,782
- Australia and New Zealand 1,333
- Other Asian Countries / Regions 19,354
- Others 476
Humanist Society (Singapore) in numbers
- Organized 238 events, both online and in-person
- Engaged about 7,000 participants [1]
- Secured 57 mentions in the media
- Built a combined online following of 10,718 [2]
- Attracted 161,000 views for our humanism YouTube video
- Attended about 30 major interfaith events [3]
- Documented 38 personal stories
- Published 307 articles on various topics
- Sent 240 newsletters to our members
- Shot 3600 photos of the humanist movement
(Last updated Dec 2021 / Next update is Dec 2022)
Key figures inside IPS Working Papers
[IPS] – The non-religious on religion in the public sphere
- Pg 25, on the religiousity of the non-religious
16.8% — Very non-religious
23.9% — Somewhat non-religious
19.3% — Neither religious or non-religious
30.1% — Somewhat religious
8.4% — Very religious
1.6% –Extremely religious
- Pg 26, spirituality
65% — I don’t follow a religion, I am not a spiritual person
27.1% — I don’t follow a religion, I am a spiritual person
6.6% — I follow a religion, I am not a spiritual person
1.3% — I follow a religion, I am not a spiritual person
- Pg 34, the non-religious and belief in God
49.6% — I don’t believe in God now and I never have
18.5% — I don’t believe in God now, but I used to
12.5% — I believe in God now, but I didn’t use to
19.5% — I believe in God now and I always have
Pg 36, Non-religious and belief in afterlife
24.1% — No, definitely not
23.8% — No, probably not
35.9% — Yes, probably
16.1% — Yes, definitely
[IPS] – The non-religious and religiosity
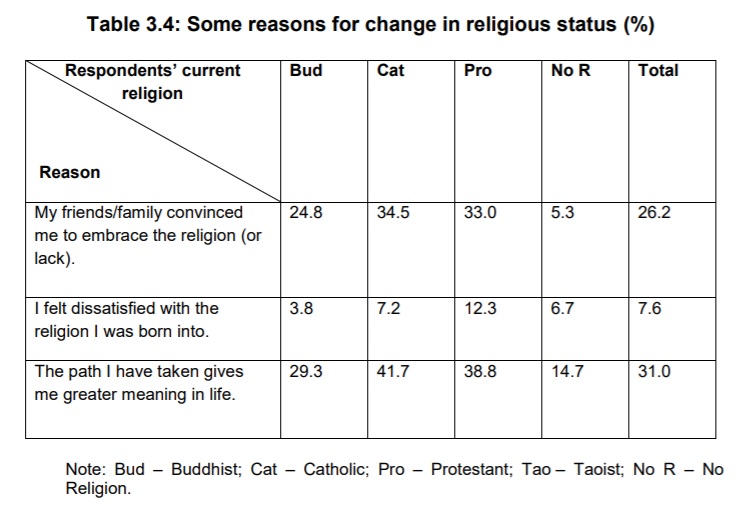
- Pg 21, on reasons for people to switch religion. Friends/family persuasion and greater meaning in life are the top two factors.
[IPS] – The non-religious and attitudes towards moral issues]
- Pg 91, on adapting religion and religious customs to changing secular realities (A) vs keeping religion as pure/traditional as possible (B). About 20% of non-religious prefer to keep B.
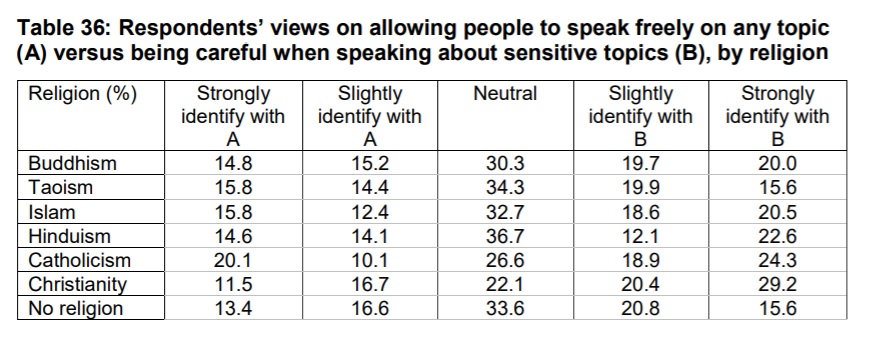
- Pg 76, attitudes towards speaking about sensitive topics
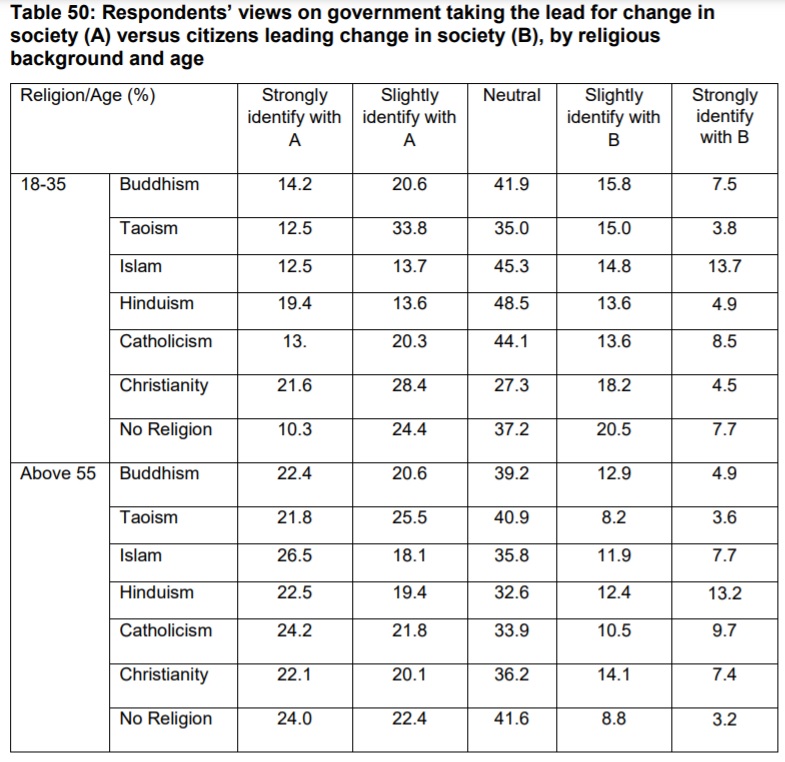
- Pg 84, on govt leading change in society
[IPS] – Faultlines in Singapore: Public Opinion and their realities]
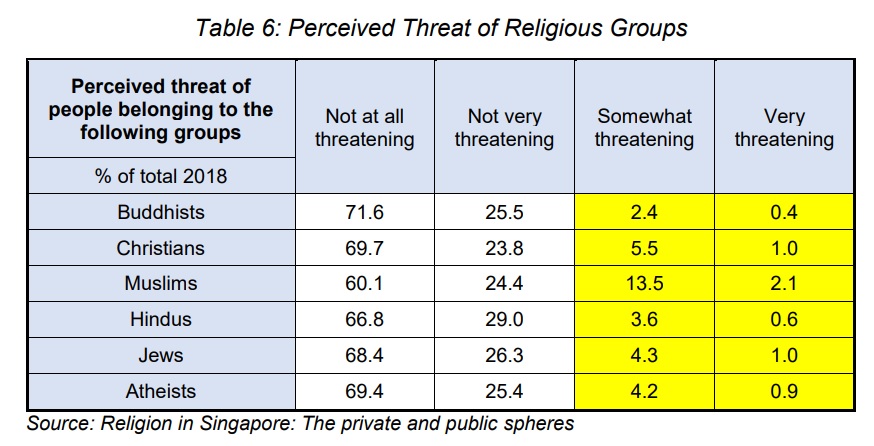
Pg. 20, perceived threats of religious groups. 95% of Singaporeans do not see atheists as somewhat/very threatening. There is a small fringe who will find atheists threatening, but this must be balanced with the fact that every religion will experience a small fringe that find them threatening.
Old 2015 statistics (from April 2015)
Total Resident population
3,105,748
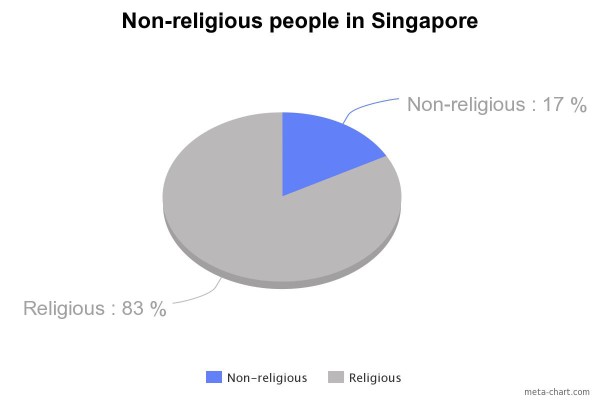
Total religious: 2,578,196, or 83%
Total non-religious: 527,553, or 17%
Source: Department of Statistics, Singapore
NOTE:
The non-religious form a significant minority in Singapore. From 1980 to 2010, their proportion of the total population has increased from 13 to 17 per cent. Singapore’s non-religious tend to be atheists, agnostics, humanists, theists and skeptics. Some of them are culturally religious as well. There are also some residents who are not affiliated with any religion, but still choose to practice traditional rituals such as ancestor worship.
Total non-religious population:
527,553
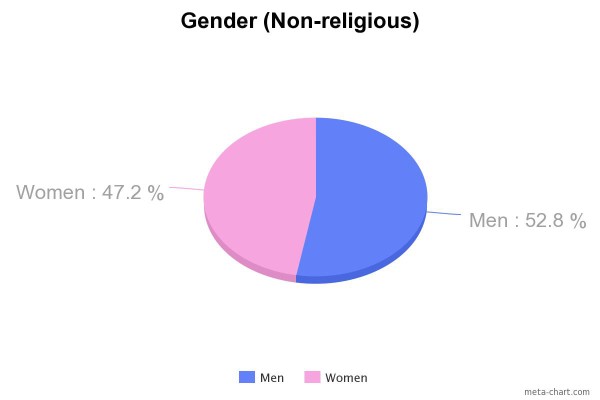
Male: 278,683, or 52.8% (National average: 48.9%)
Female: 248,870, or 47.2% (National average: 51.1%)
Source: Department of Statistics, Singapore
NOTE:
Among non-religious residents, there are slightly more men than women. However, this difference is negligable. In general, men are more willing to express their humanist and atheist thoughts, and are more likely to join humanist organisations.
Citizens: 441,453, or 83.7% (National average: 85.5%)
PRs: 86,100, or 16.3% (National average: 14.5%)
Source: Department of Statistics, Singapore
NOTE:
The proportion of citizens and permanent residents (PRs) within Singapore’s non-religious resident population roughly mirrors the situation across the whole country. Permanent residents form a slightly higher proportion within the non-religious segment, relative to the rest of the resident population. Our Humanist Society itself, however, is much more cosmopolitan. Our gatherings attract participants not from ASEAN countries, but also countries as far as Pakistan, Iran, South Africa and Australia. We have also hosted reowned authors and speakers when they drop by in Singapore.
Where the non-religious stay in Singapore:
HDB: 397,724 or 75.4% (National average: 82.5%)
Condominiums and Private Flats: 787,49 or 14.9% (National average: 10.1%)
Landed: 47,223 or 9.0 % (National average: 6.7%)
Others 3,857 or 0.7% (National average: 0.7%)
Source: Department of Statistics, Singapore
NOTE:
The non-religious population in Singapore, on average, is slightly better off than the average citizen. While a clear majority – about three in four non-religious residents – reside in the government subsidised private housing, the proportion of non-religious residents living in condomiums, private flats and landed propertities are higher than the national average.
Total number of graduates:
634,098
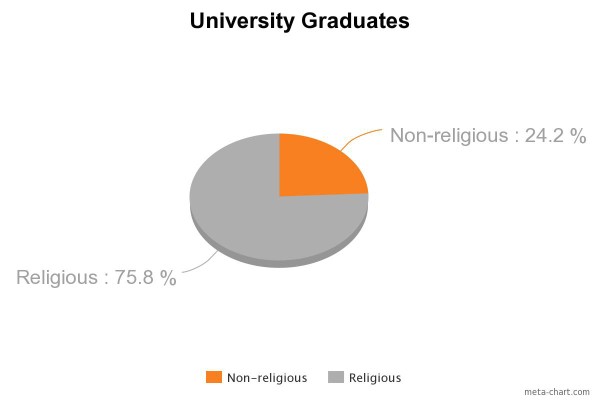
Non-religious: 153,275, or 24.2% of graduates
Religious: 480822, 75.8% of graduates
Source: Department of Statistics, Singapore
NOTE:
The non-religious residents, in general, are slightly better educated than the average resident. Although non-religious residents comprise 17% of the total population, they make up 24.2% of all graduates. However, the non-religious is not the largest group within the graduate and undergraduate population. Statistics from the 2010 census show that Christianity and Buddhism are among the most popular religions for university graduates and undergraduates. For more information on this, please refer to the Department of Statistics website.
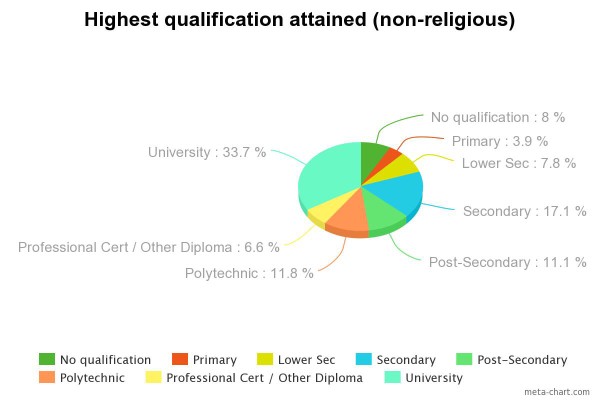
Highest qualfication attained by non-religious residents
No qualification: 36,318, or 8% (National average: 15.3%)
Primary: 17,810, or 3.9% (National average: 7.0%)
Lower Secondary: 35,309, or 7.8% (National average: 10.2%)
Secondary: 77,852, or 17.1% (National average: 18.9%)
Post-Secondary (Non-tertiary): 50,730, or 11.1% (National average: 11.1%)
Polytechnic: 53,657, or 11.8% (National average: 9%)
Professional Qualification and Other Diploma 30,146, or 6.6% (National average: 5.8%)
University 153,275, or 33.7% (National average: 22.8%)
Source: Department of Statistics, Singapore
NOTE:
The varying educational levels attained by non-religious residents show that freethinkers here come from all walks of life and academic backgrounds. About one in three non-religious residents are college graduates. The number of polytechnic graduates and those with professional qualifications or other diplomas, are also higher than the national average. At the same time, a significant number of non-religious residents (8%) do not have any qualifications. Close to one in four non-religious residents attained up to secondary or lower secondary education.


